Kāykari Kaaran
Pronounced Kaigari KaaranMapping the route of vegetables
The project is aimed at surveying the everyday street vendor. As vendors are an integral part of the informal distribution system, more so due to the pandemic, it is important to establish an understanding of the economic and infrastructural network that shapes their livelihood. The project was initially developed during Budapest's AA Visiting School. Open-source mapping techniques and on-ground interviews helped document specific problem points.
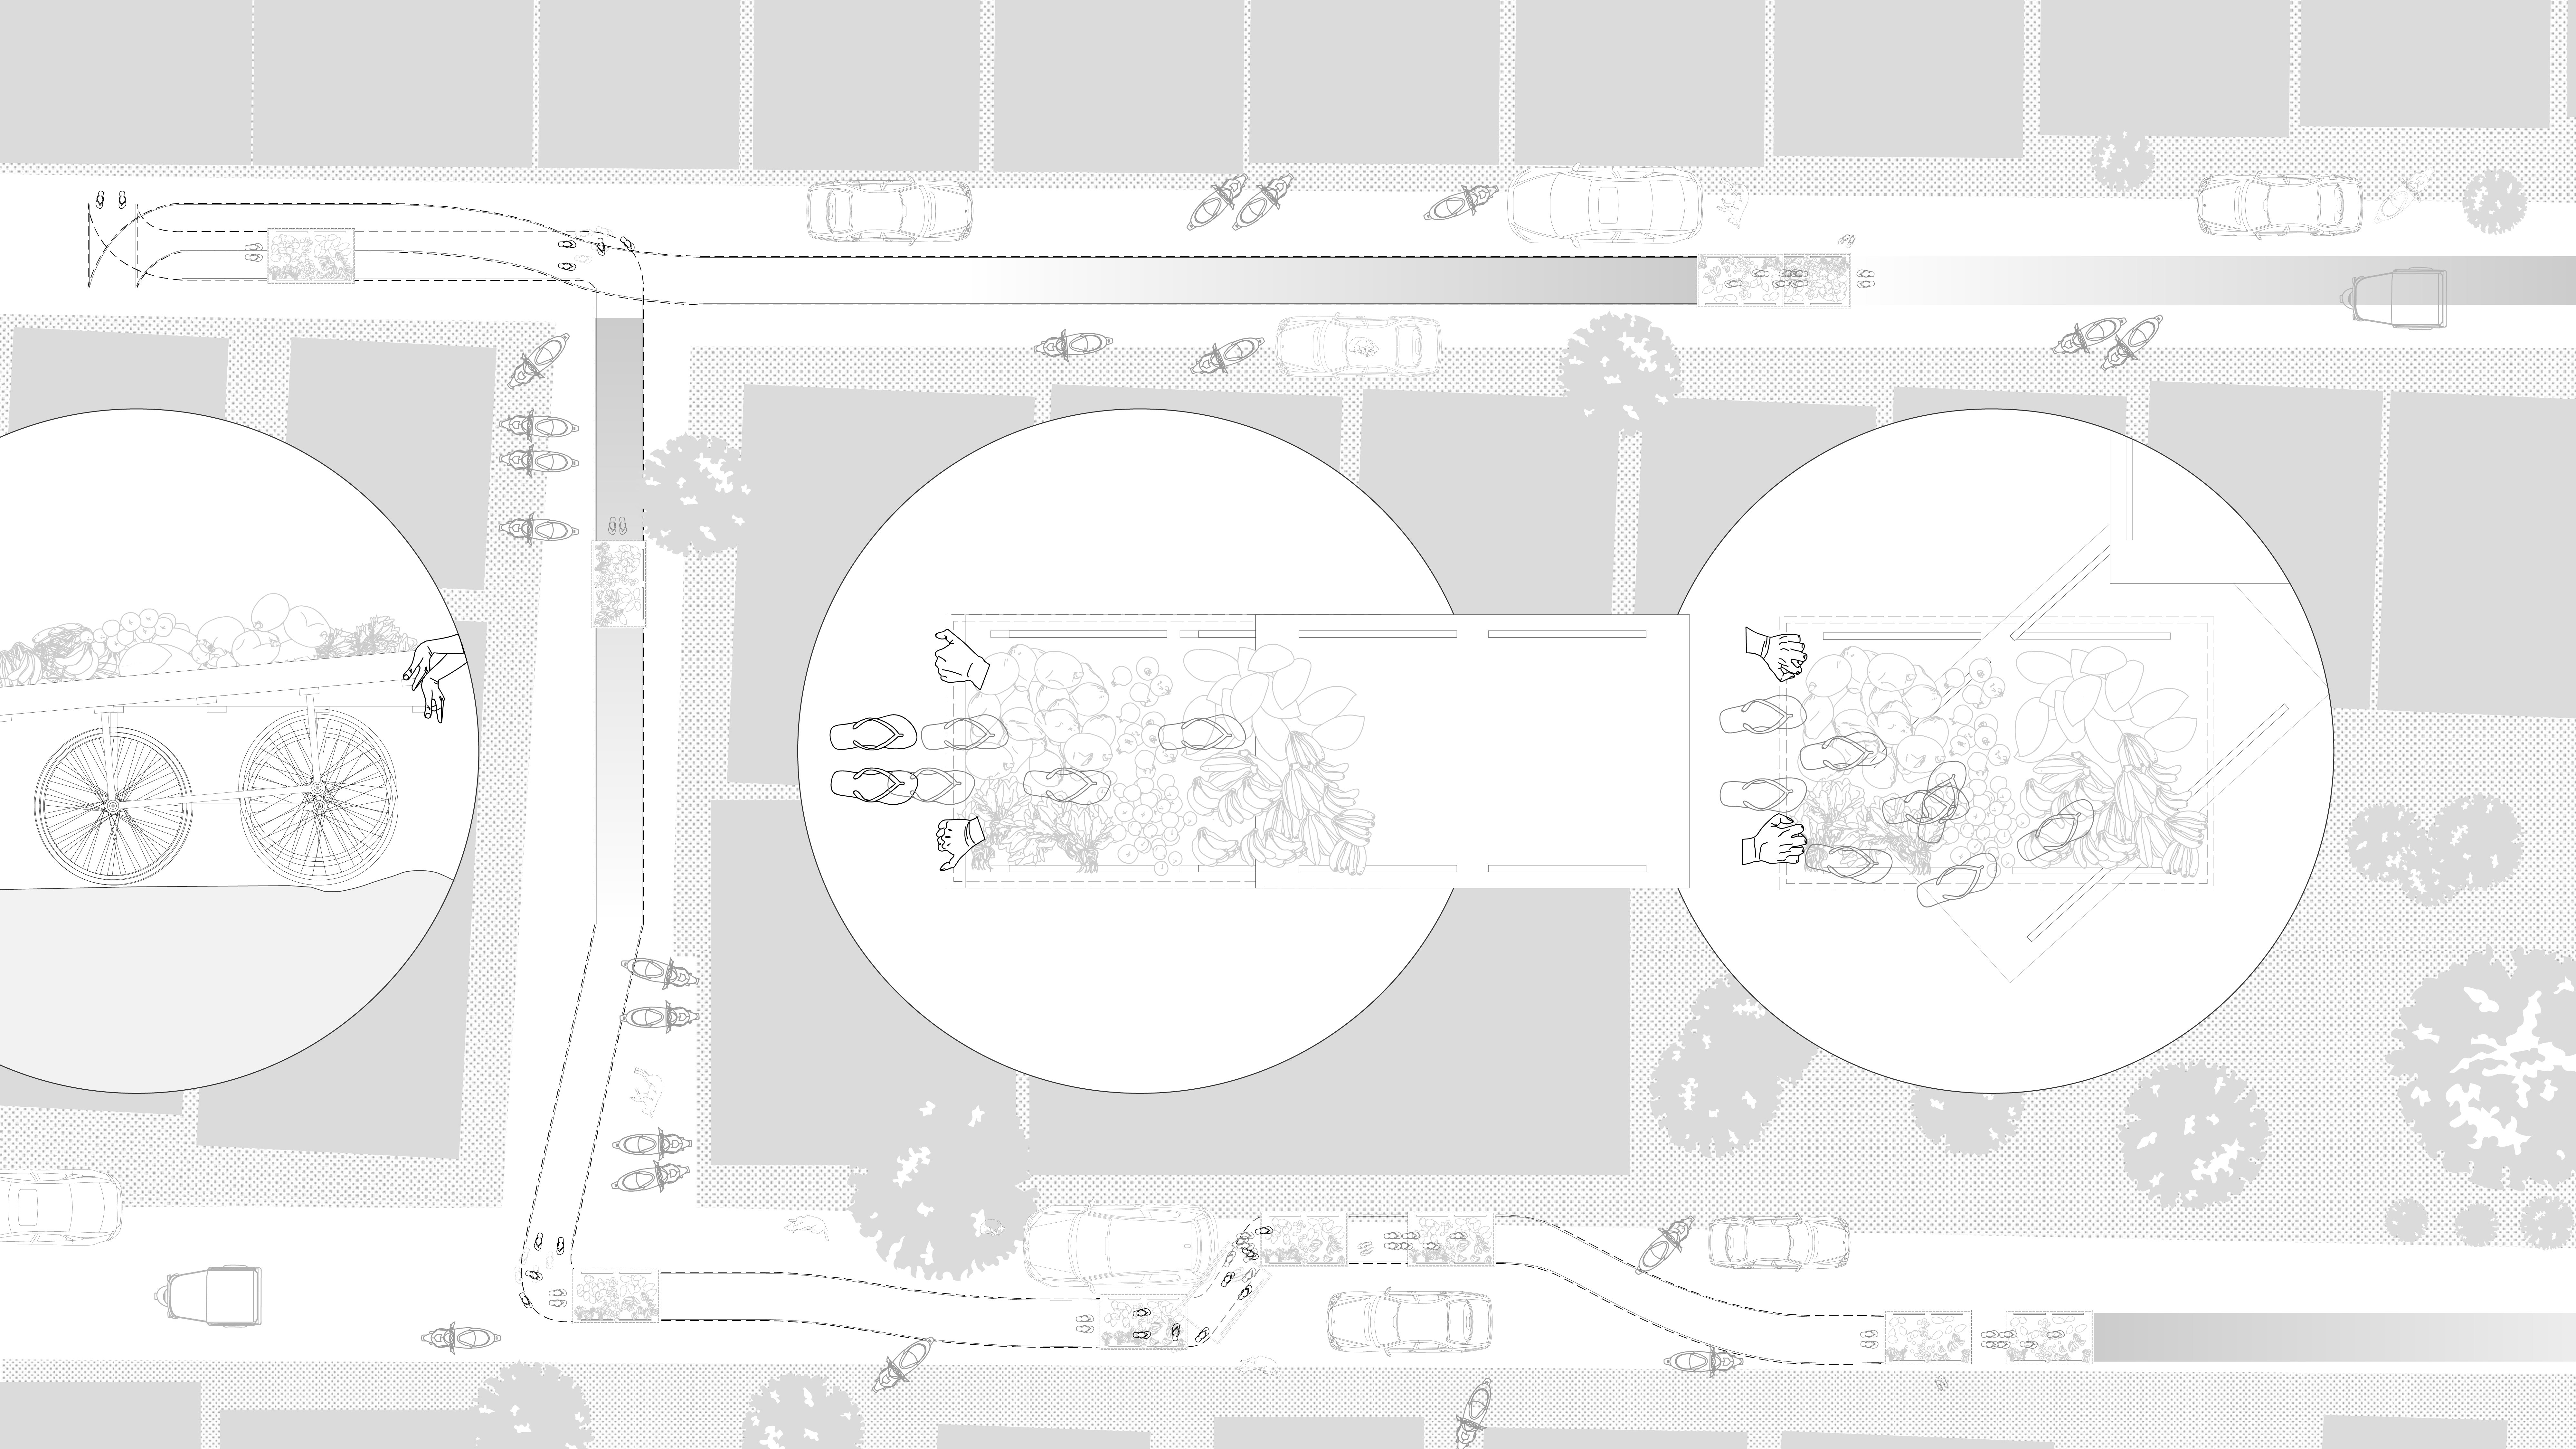
Drawing: Neighbourhood Level Activity Plan
Context: In 2014, a Street Vendors (Protection of Livelihoods and Regulation) Act was passed. Every vendor must be issued a license and be allocated certain area. However, the rules of the act have not yet been devised in certain areas within the state of Karnataka leaving vendors vulnerable to harassment and forced payouts by the local police although, they cannot be displaced for any reason due to this.
Kaygari Kaaran is a project that looks at the relationship of the vendor, his pushcart and the street. Through a series of architectural drawings, the gesture, movement, and the typical setup are documented.
Drawing:
Movement of the vendor with his cart (Pushing, Lifting, and Turning)
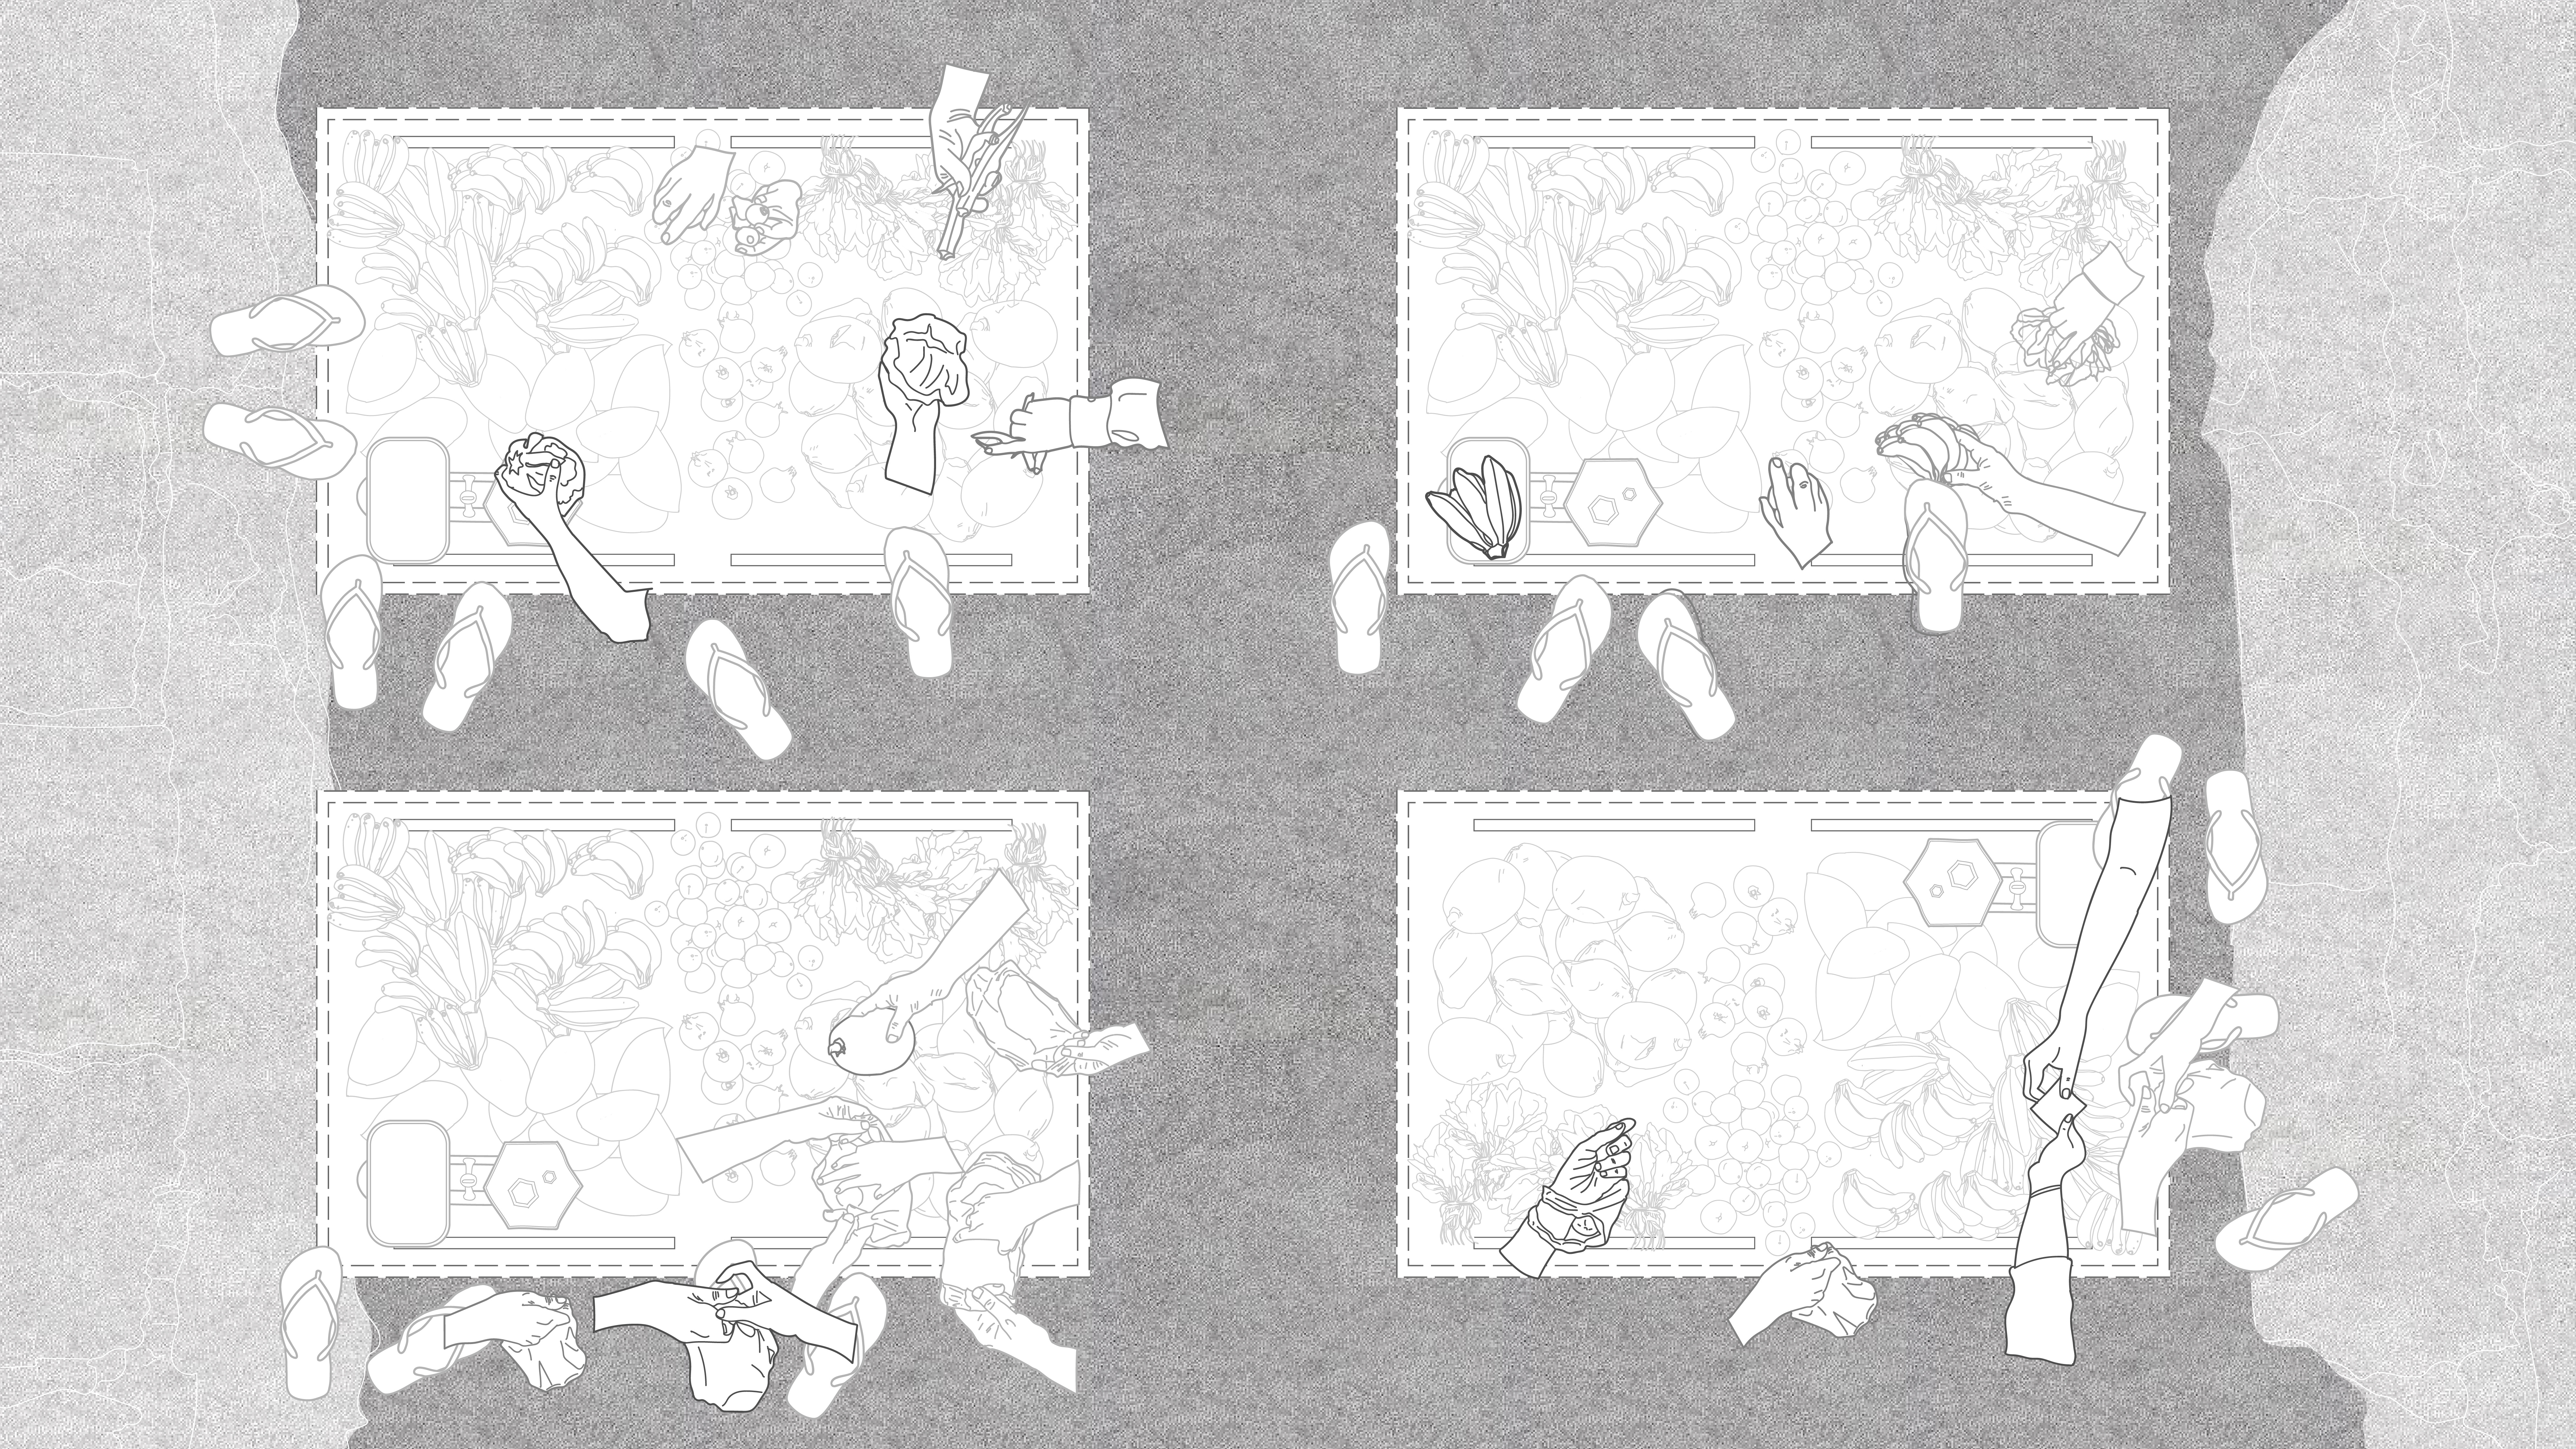
Drawing: I
nteractions over the cart
Observations: Moving vendors typically have a hard time in certain neighbourhoods due to traffic and road conditions. There is a set routine they follow everyday in order to purchase vegetables in wholesale markets and sell them. This can be disturbed due to the climate and external forces like the police. Wages differ from day-to-day and due to the ripening of food related items.
Permanent vendors face more police related issues and theft of objects from their setup. They position themselves favourably, in a visible spot within a locality for better business. A large number of objects come from construction material or second-hand objects appropriated.
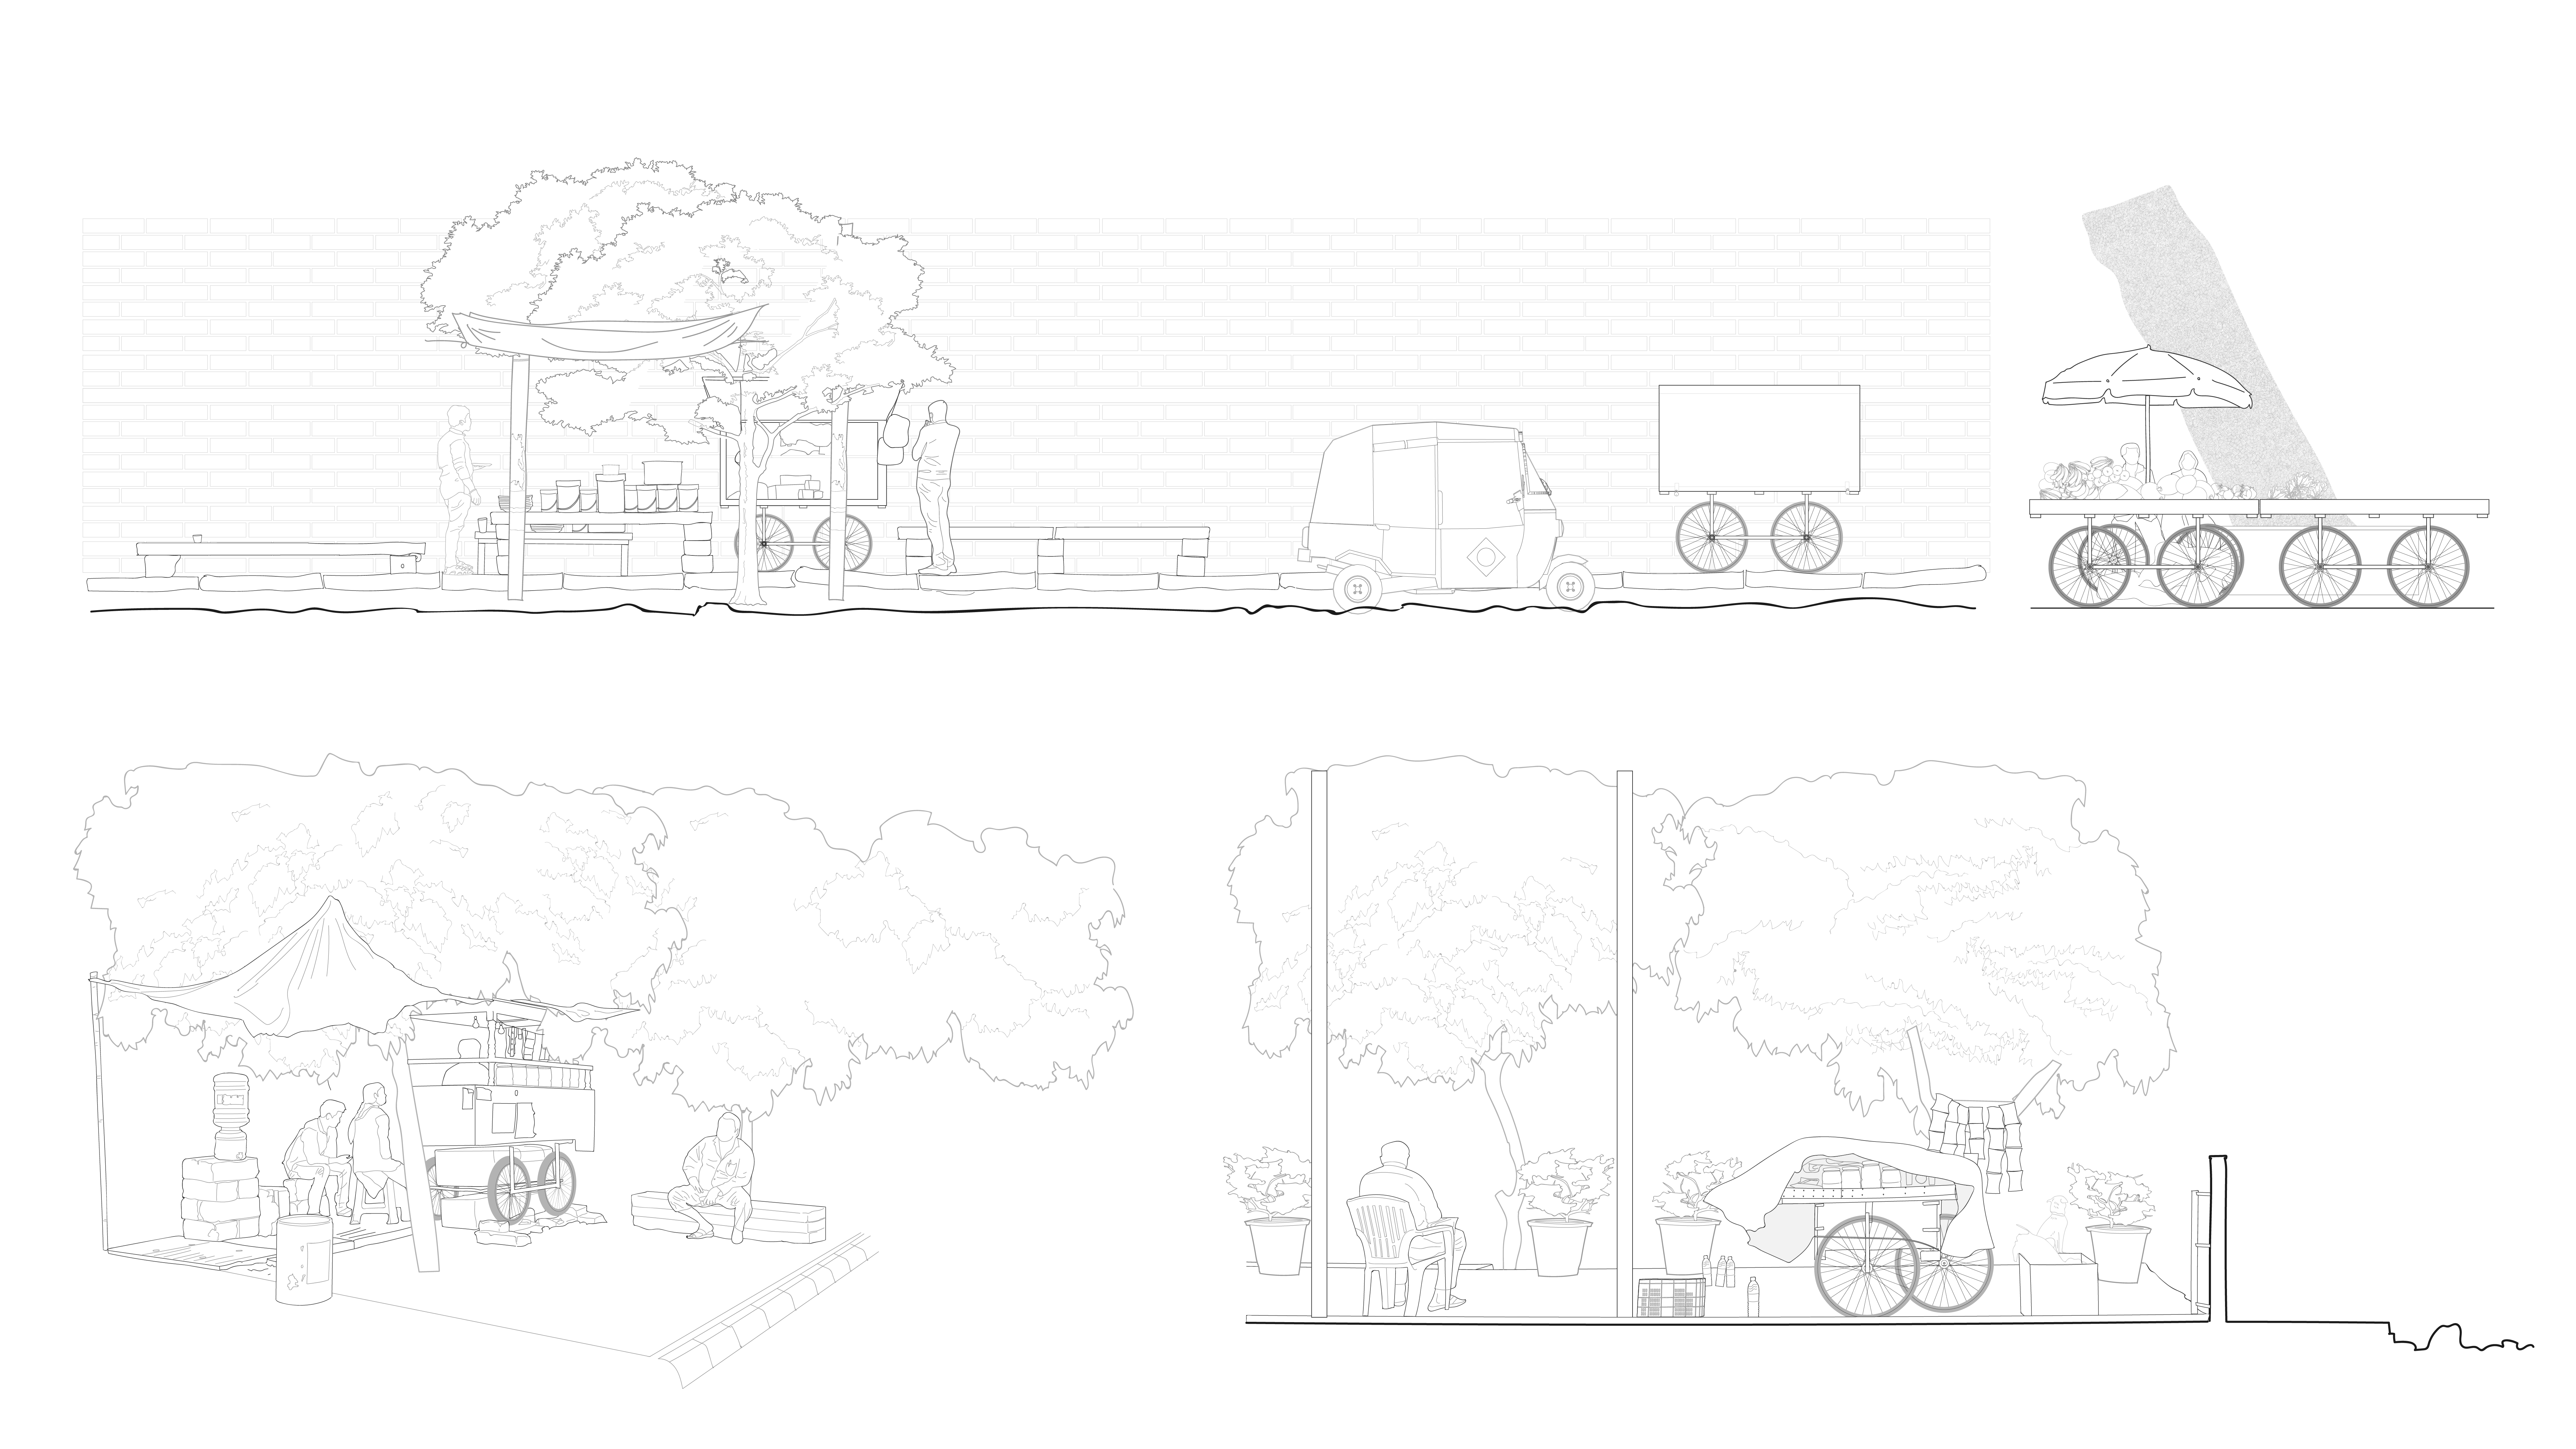
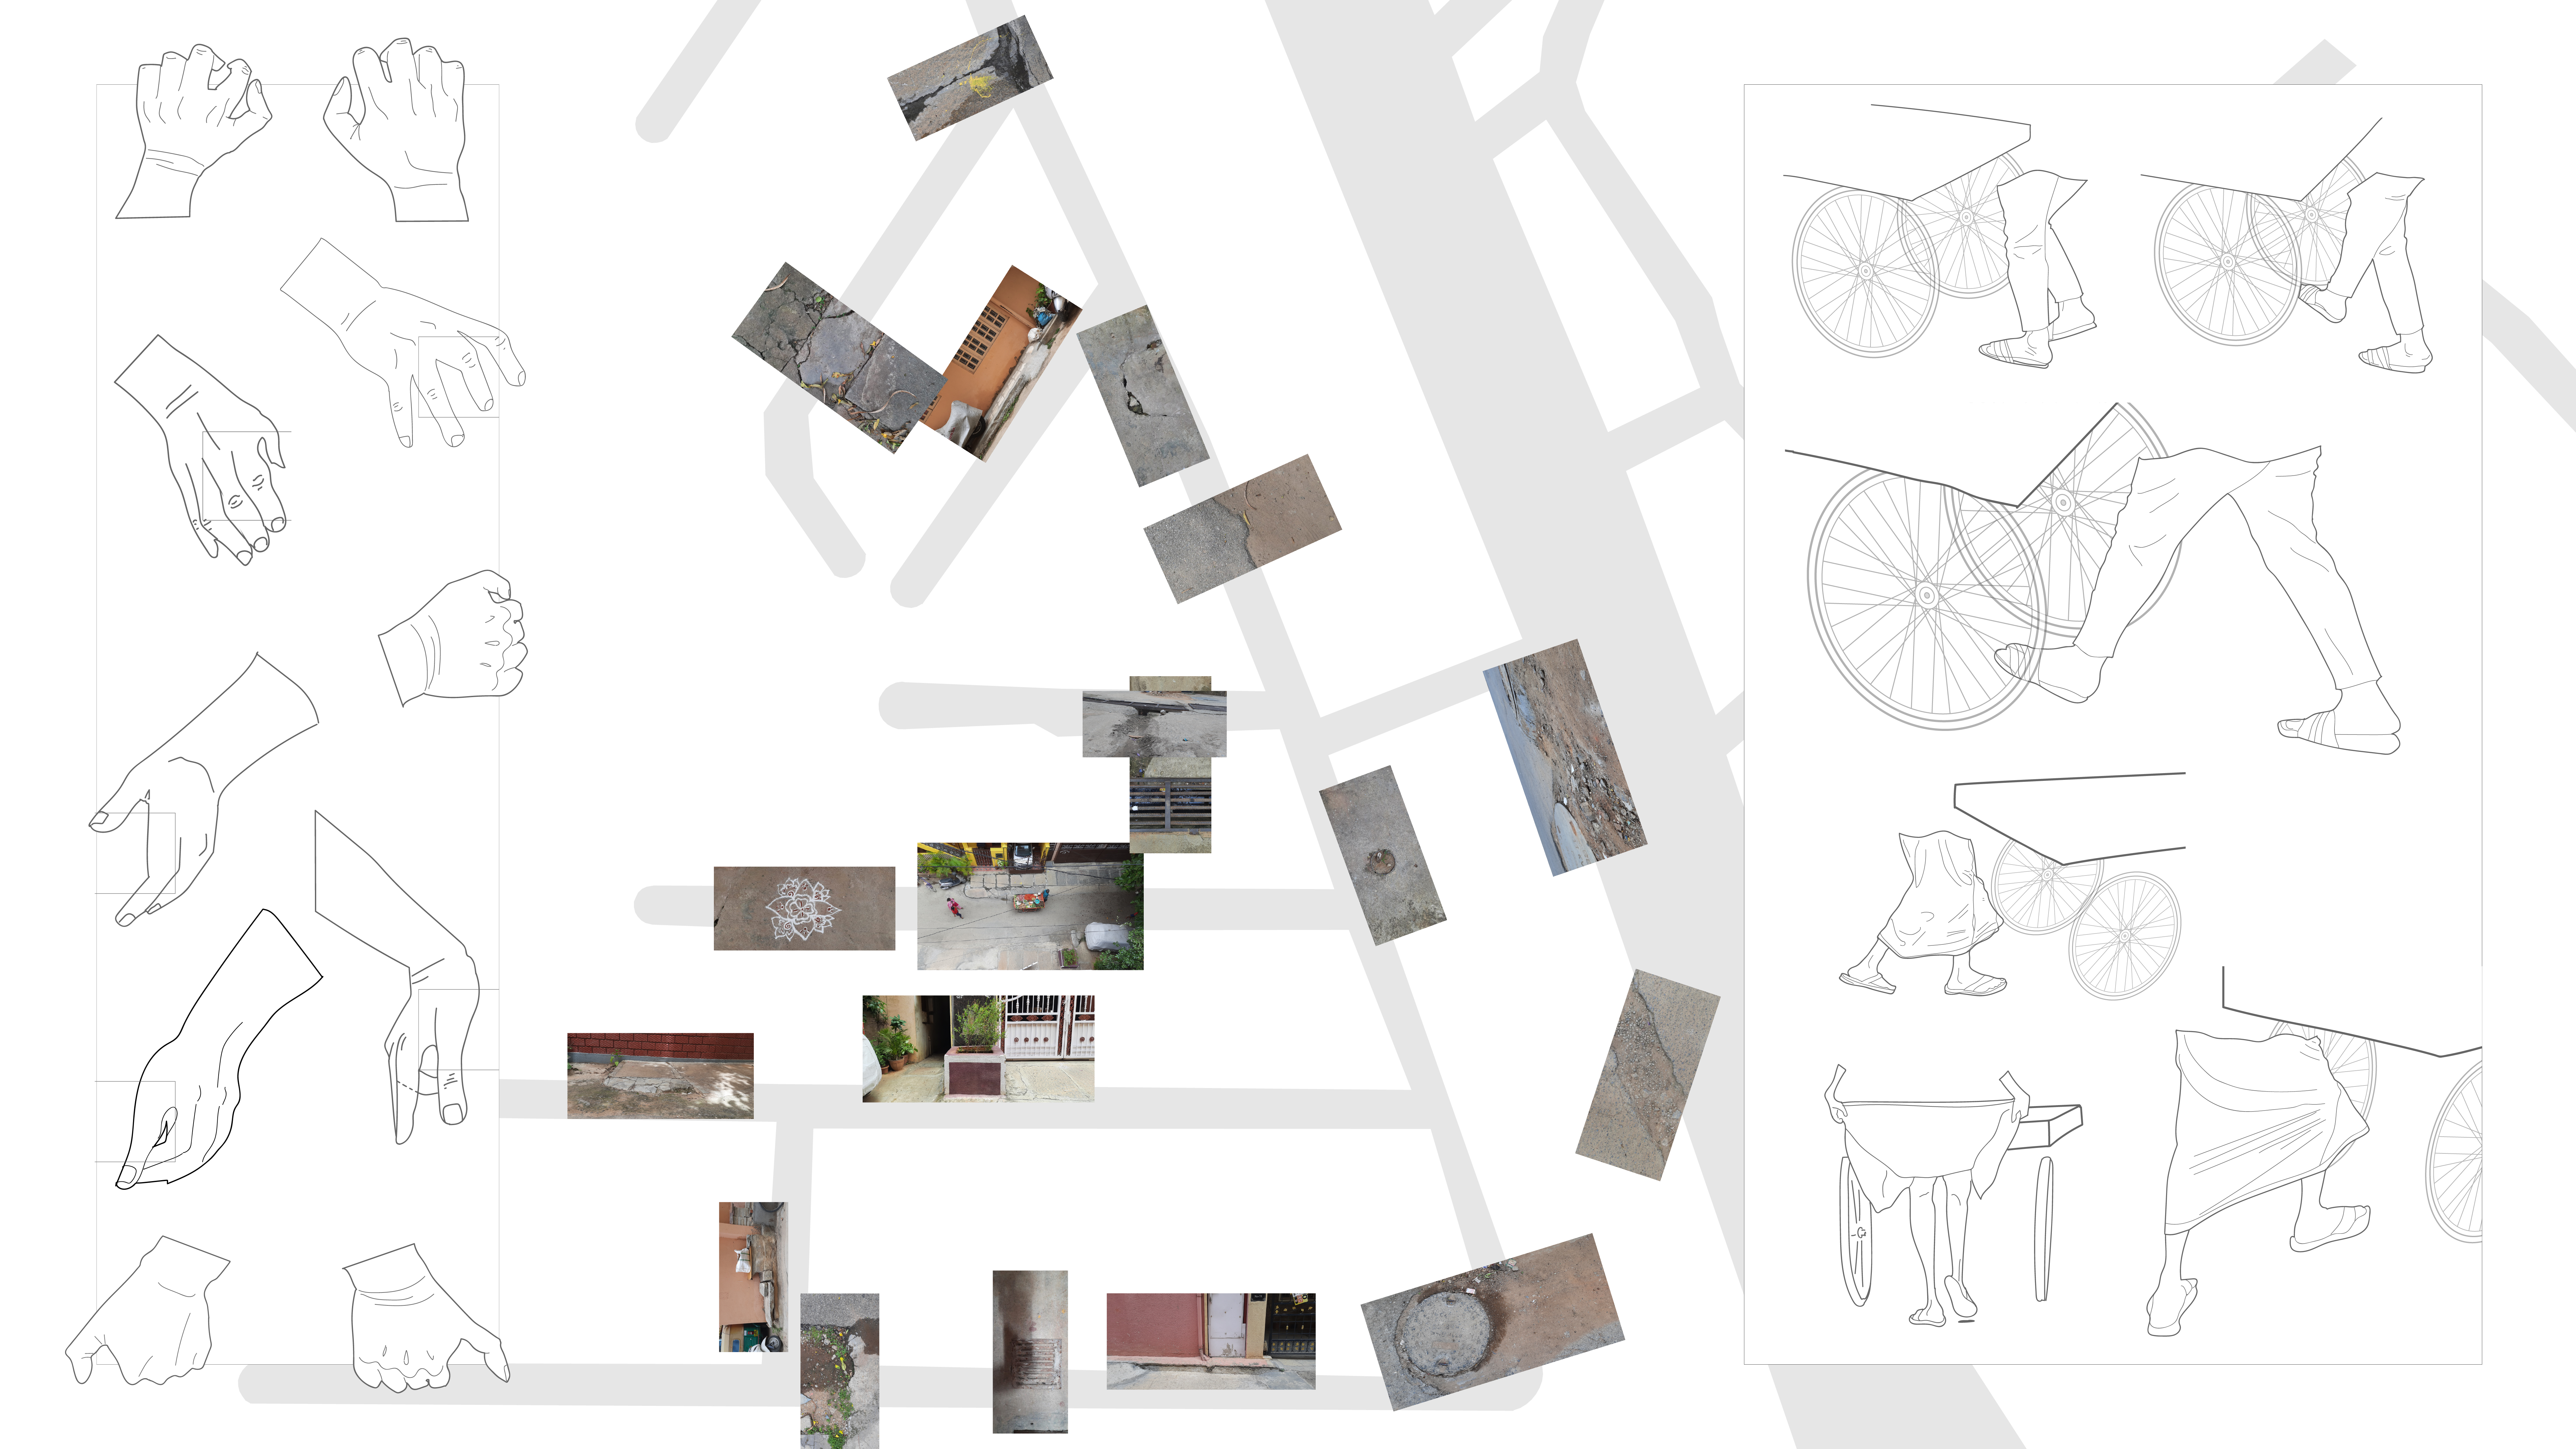
Drawing: Documenting On-Site Setups

Drawing: Documenting On-Site Objects
Interviews: Problems of Vendors
Conclusion: Through this documentation, defining problem points to be mapped was possible. Using qGIS, an interactive map was created to document possible spots that have either an infrastructural or non-infrastructural problem. Potentially, such data can be shared via SMS for use by vendors who can then use alternative routes within the neighbourhood.
Additionally, for Karnataka that is still in the process of surveying and issuing licences to vendors, citizen sensing can offer quicker solutions.
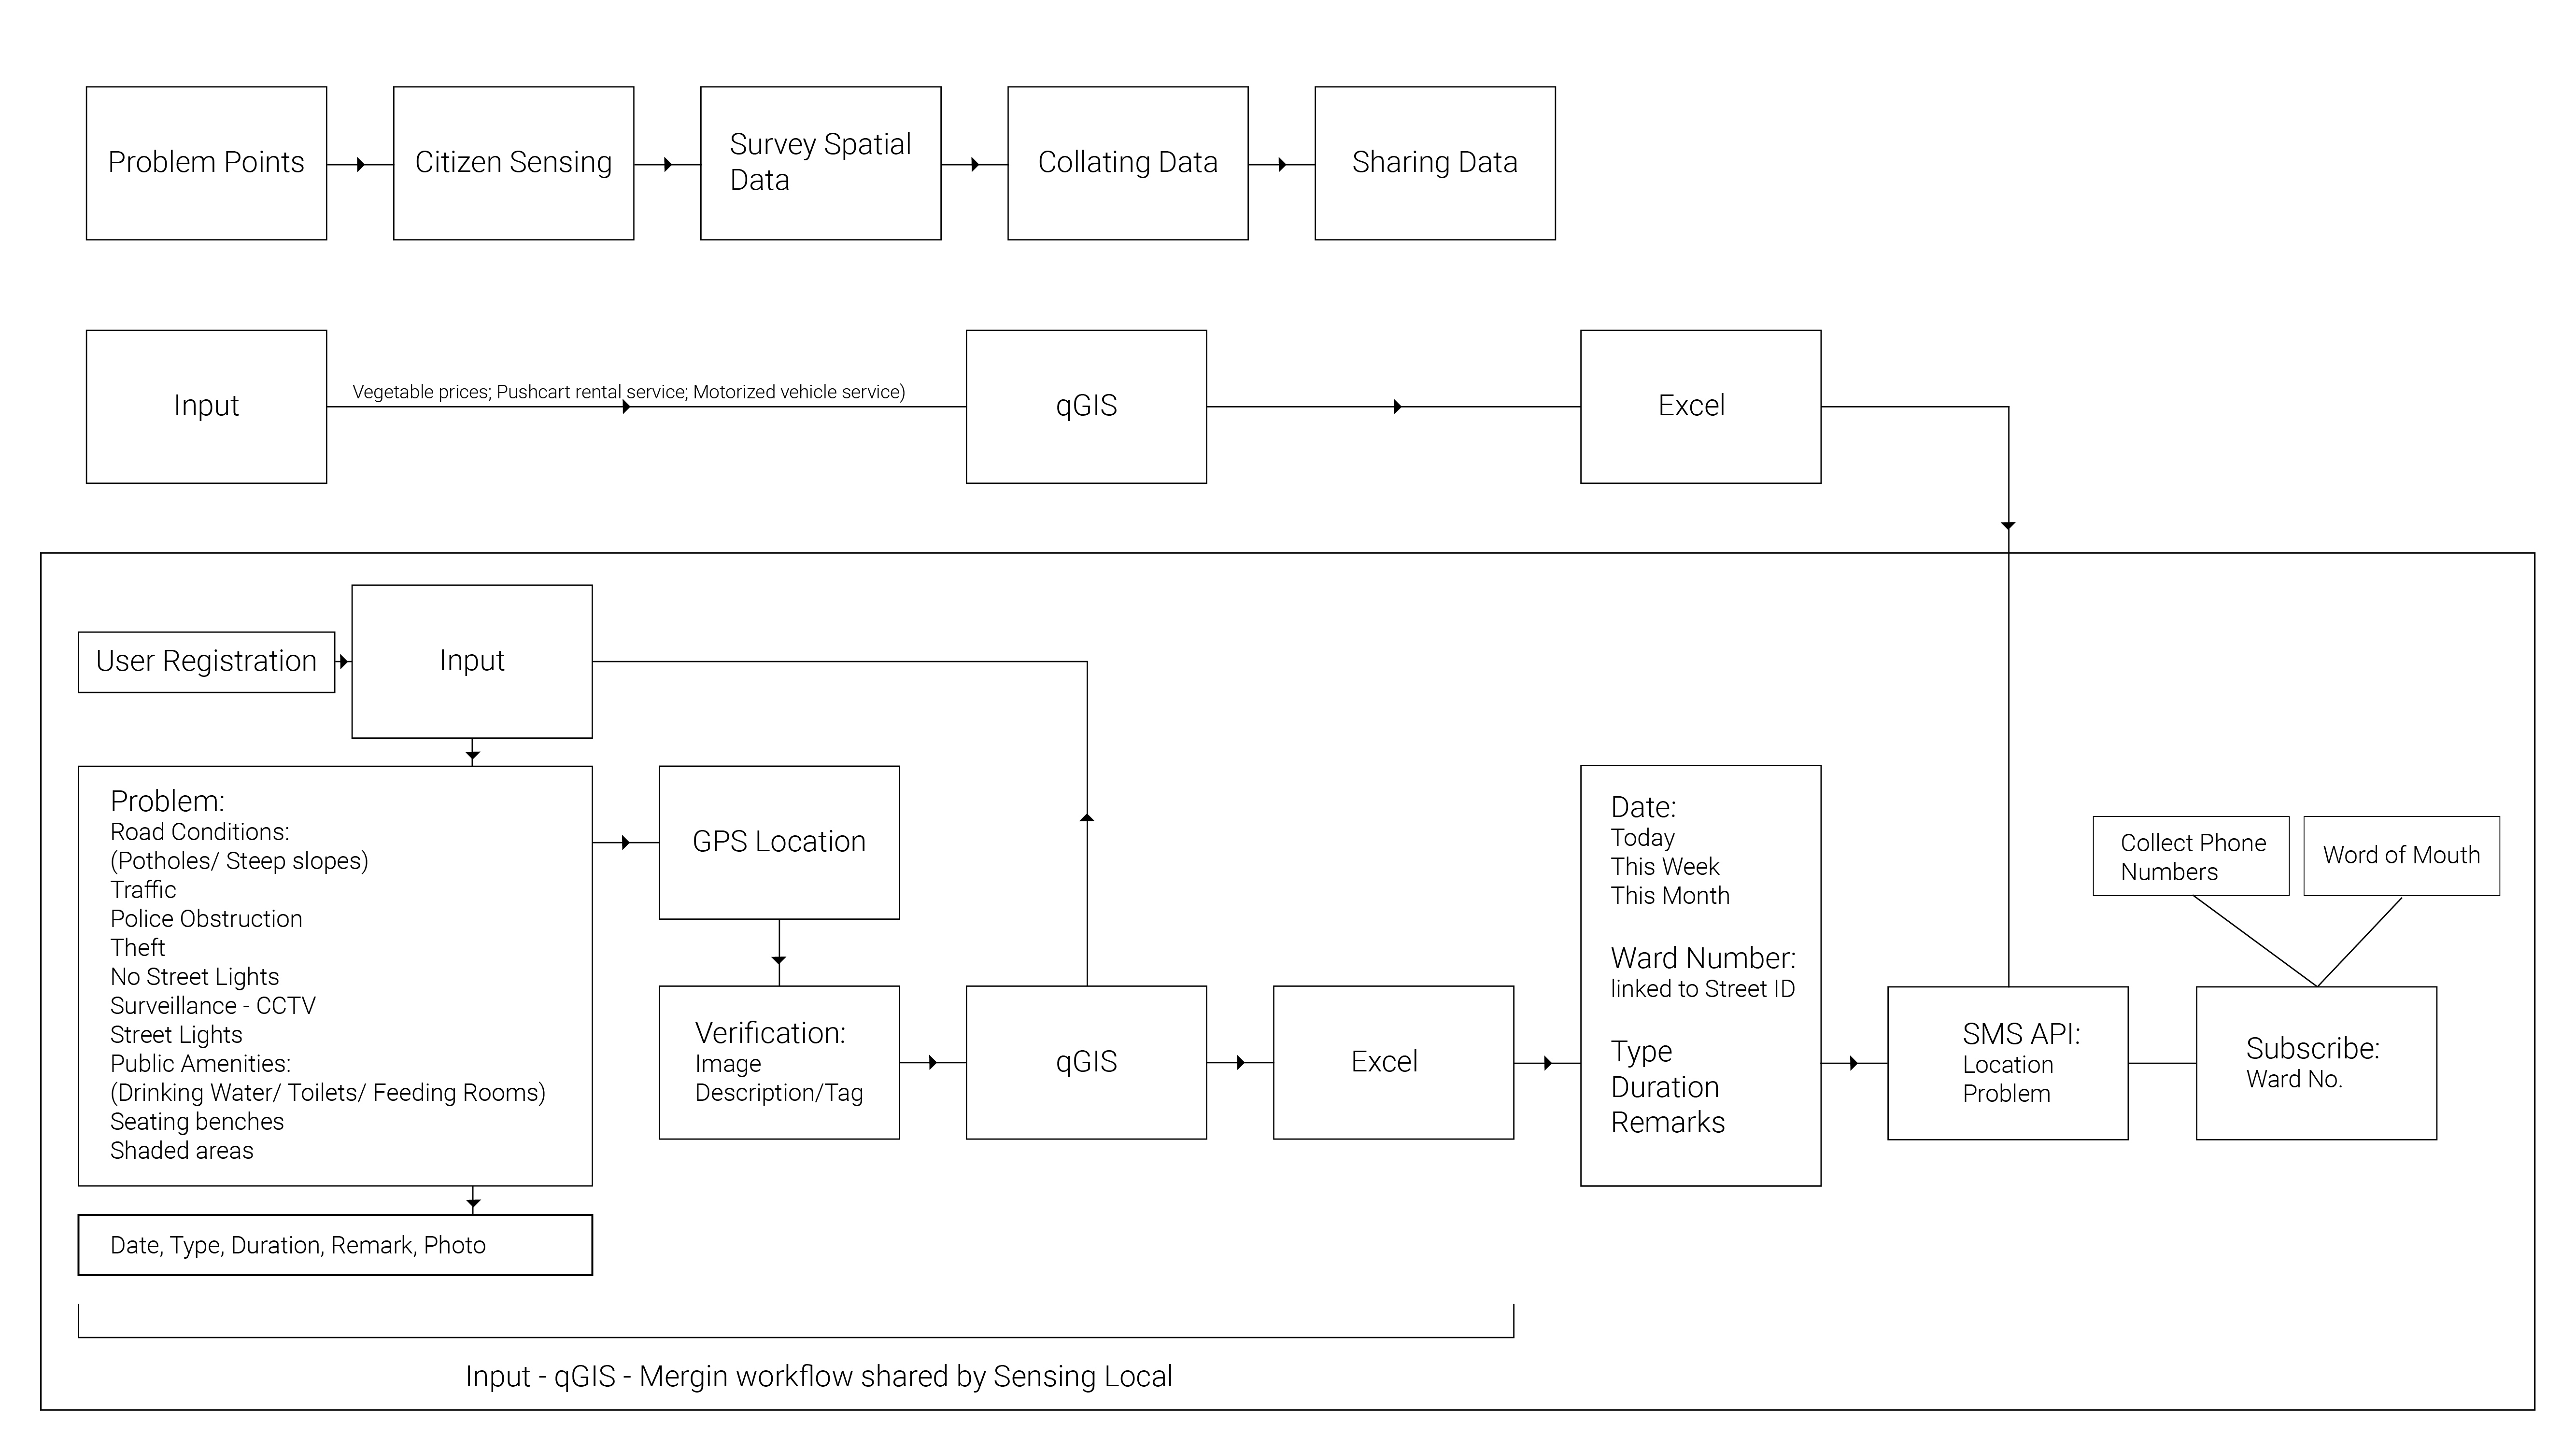
Digital workflow: qGIS; Input; Mergin for Citizen sensing
As long term solutions involve decision-making by development authorities, funding, infrastructural and urban design resolution, simple interventions through citizen sensing can offer quick relief.
Problem points are mapped at a neighbourhood scale. They are time-bound issues for certain categories like police obstruction, traffic, and theft. This information is offered as an SMS/text-to-speech subscription from the database that is created through qGIS and Input app.
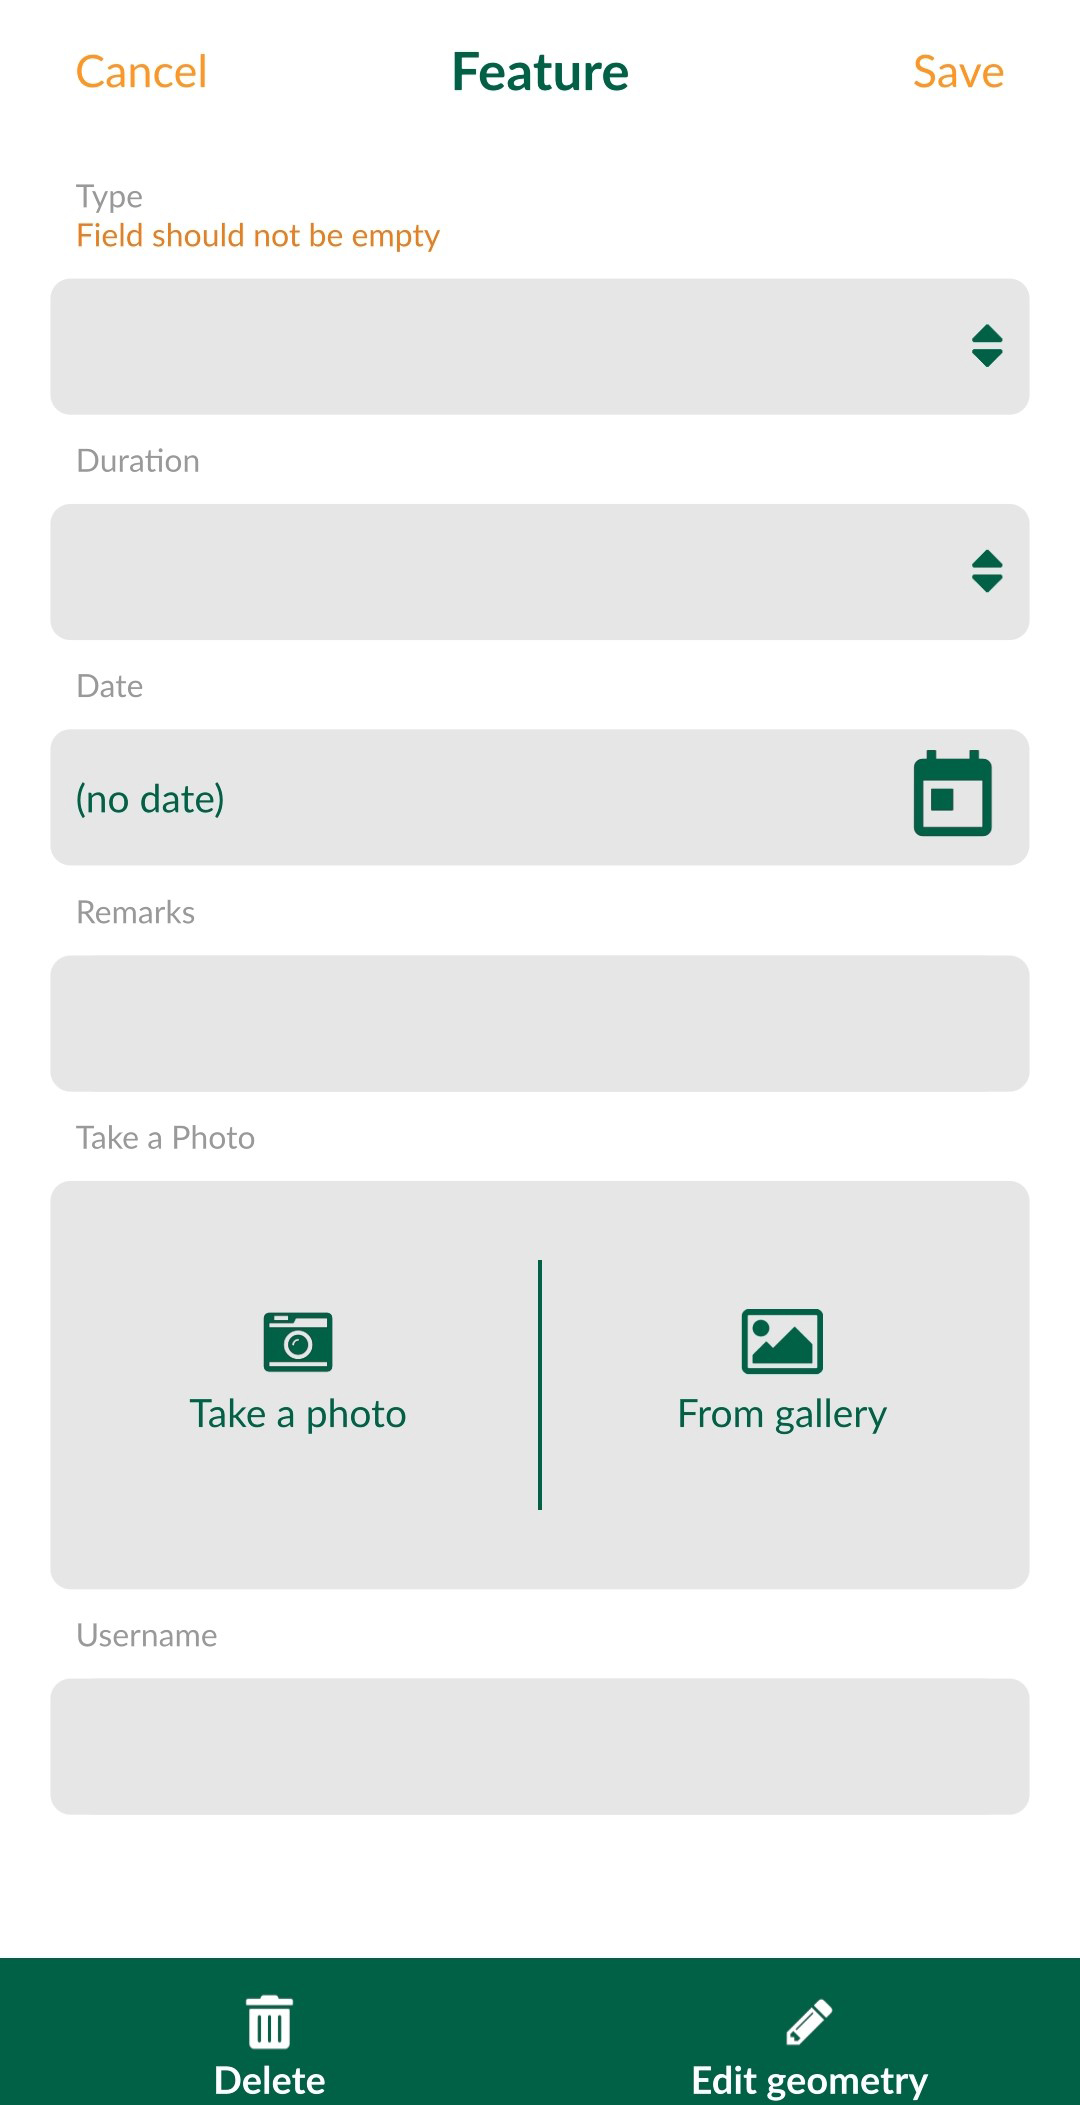


Input App: On-ground Surveying
qGIS Webmap: Collating Data
In order to generate relevant text messages, the base data collated via qGIS is export to .csv format in order to filter the data on excel.
Accordingly, a template is developed that includes the filtered date (TODAY) and Ward or Location Data.
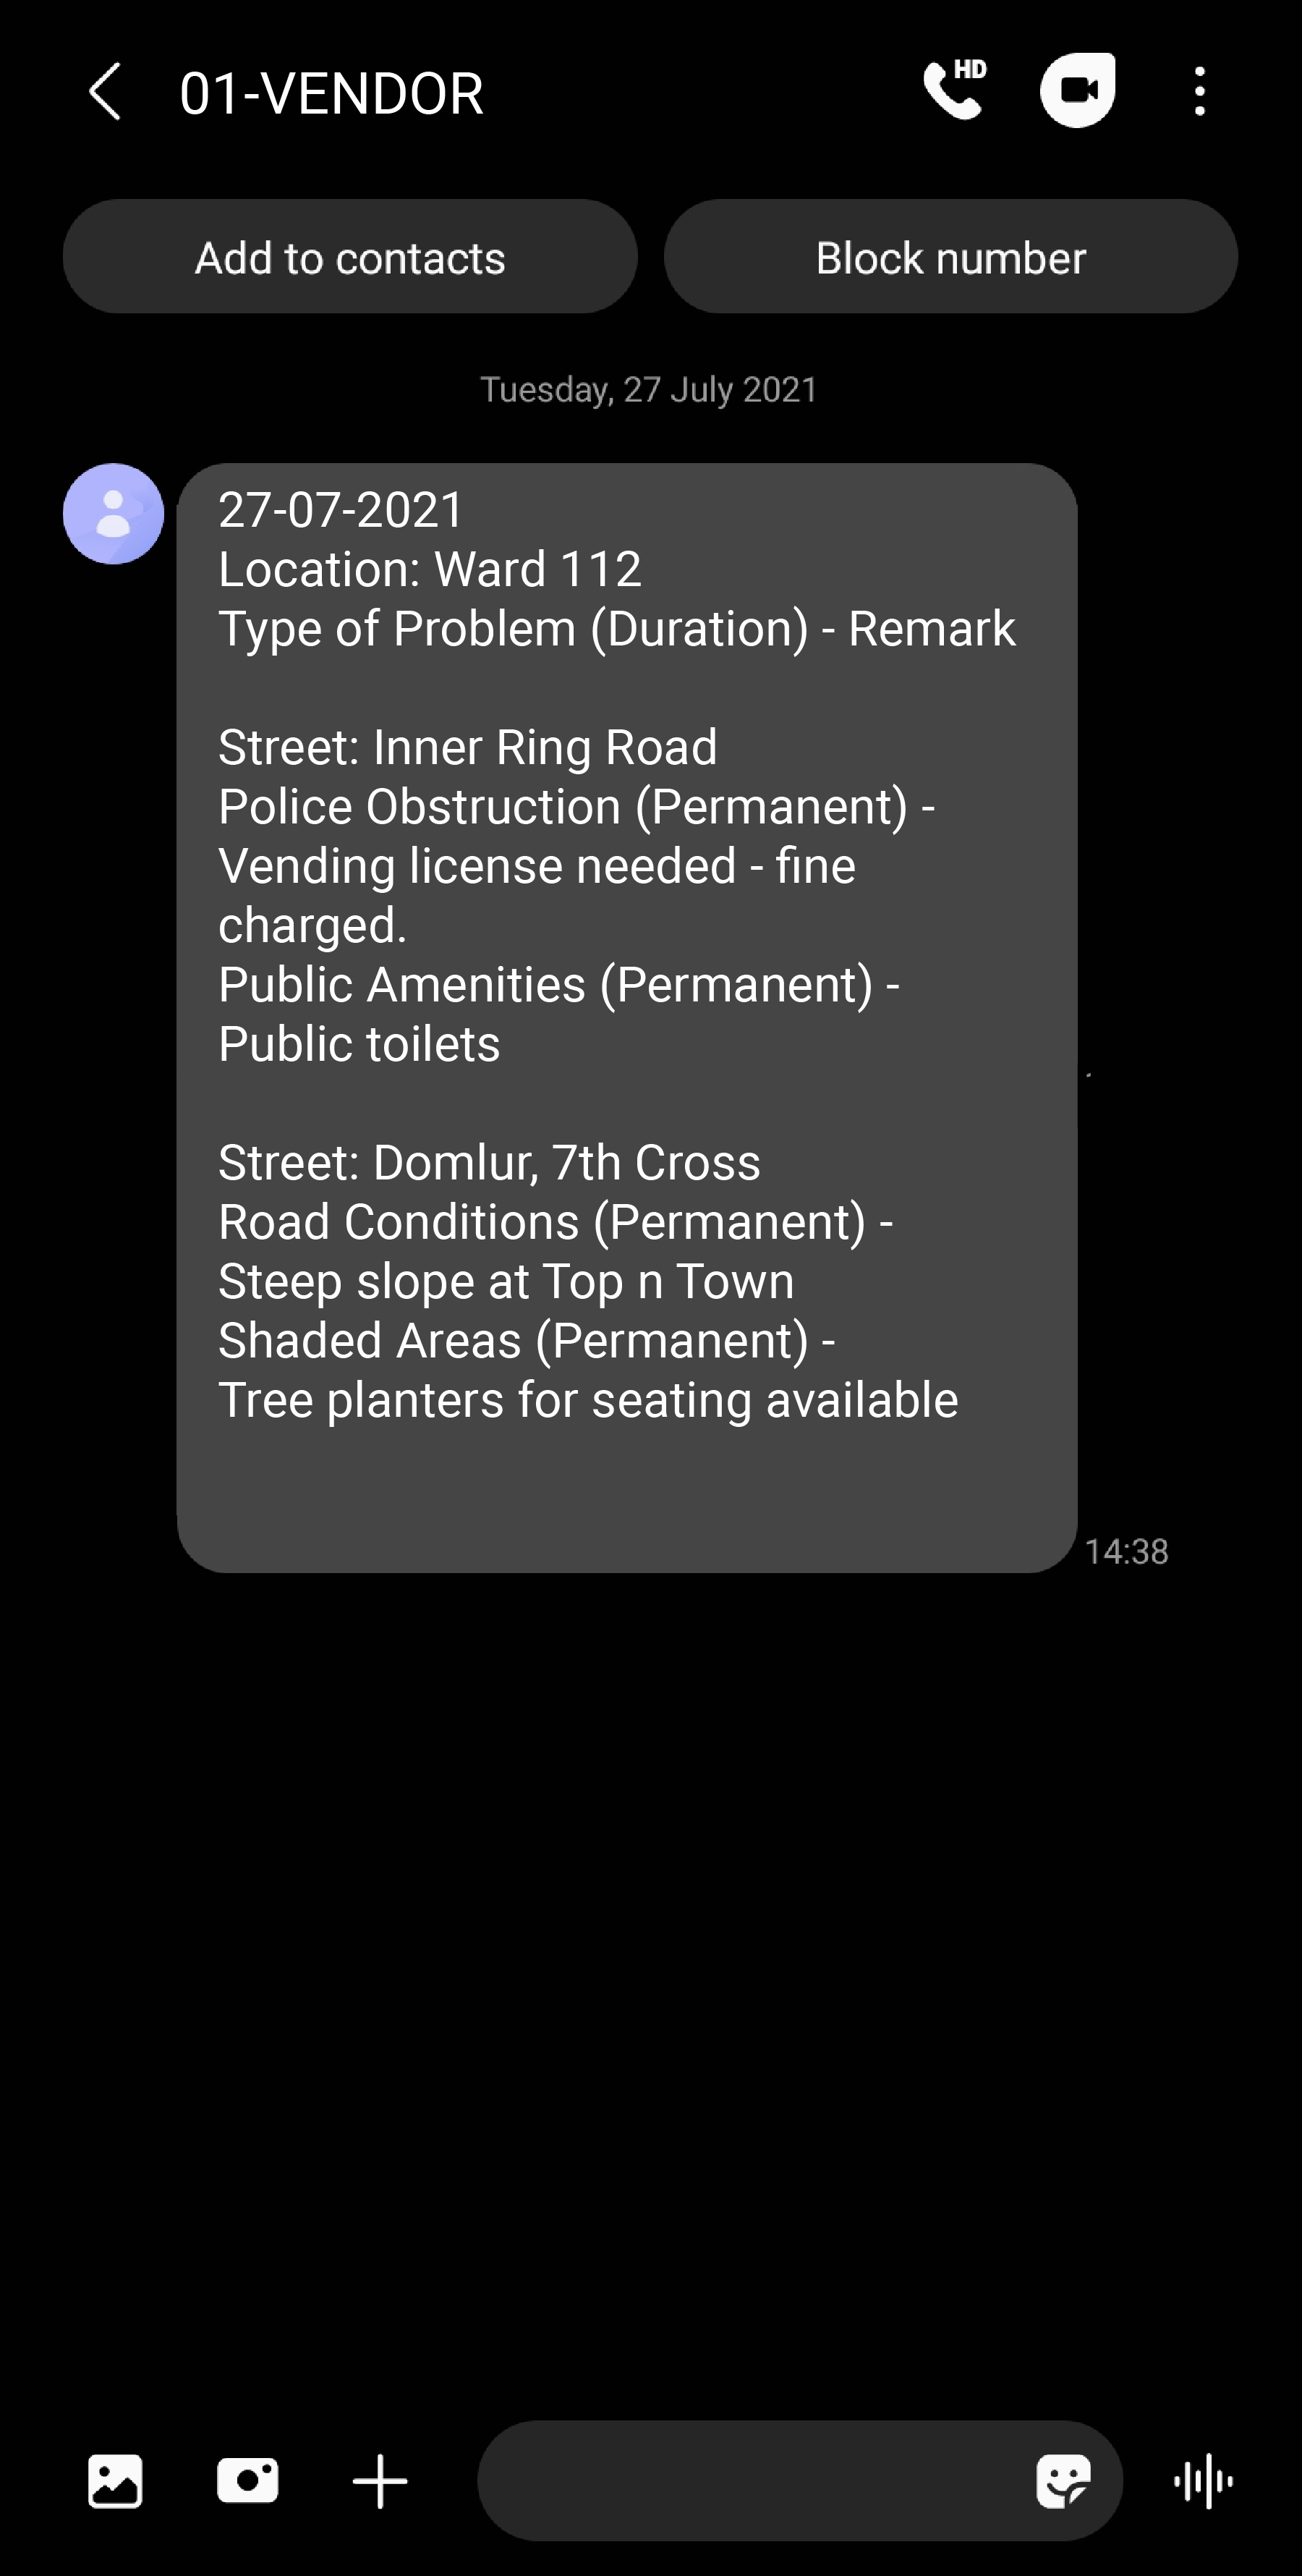
A vendor should be able to subscribe to a short number using his ward number to access daily blasts/urgent messages.
Accordingly, a template is developed that includes the filtered date (TODAY) and Ward or Location Data.
A vendor should be able to subscribe to a short number using his ward number to access daily blasts/urgent messages.
Output Text Message: Sharing Location Data